Skip to content
stockwithravi.com
Stock Market News & Analysis
Home
Stock News
Technical Analysis
Market Update
Market Analysis
Results
Trading Tips
Mutual Funds
IPO
Market Learning
Contact Us
About Us
Privacy Policy
Tag:
trading guide
trading guide
Showing the single result
Default sorting
Sort by popularity
Sort by average rating
Sort by latest
Sort by price: low to high
Sort by price: high to low
Sale!
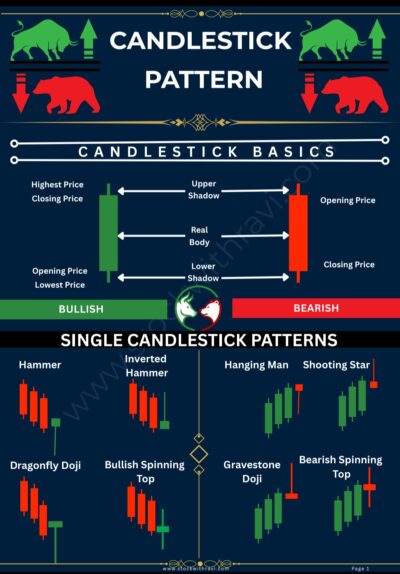
Trading Chart
Powerfull Candlestick Patterns For Trading
Rated
5.00
out of 5
₹
199.00
Original price was: ₹199.00.
₹
99.00
Current price is: ₹99.00.
Add to cart
You missed
Technical Analysis
Technical Indicators क्या होते हैं ? — और शेयर मार्केट में इनका क्या उपयोग है |
May 19, 2026
Ravi Chandrawanshi
No Comments
⚠️
Disclaimer:
Yeh article sirf educational purpose ke liye hai. Koi bhi investment apne financial advisor se salah lekar karein. StockWithRavi.com kisi bhi nuksan ke liye zimmedaar nahi hoga.
Market Learning
Stock Market Learning: शुरुआत कहाँ से करें — और क्या न करें ?
May 18, 2026
Ravi Chandrawanshi
No Comments
Mutual Funds
SIP क्या है? 2026 में SIP से पैसे कैसे कमाएं – पूरी जानकारी
May 17, 2026
Ravi Chandrawanshi
No Comments
IPO
IPO क्या होता है? पूरी जानकारी हिंदी में | StockWithRavi
May 14, 2026
Ravi Chandrawanshi
No Comments